The Economic Burden of Cancer
The economic burden of cancer is substantial in all countries and reflects health care spending as well as lost productivity due to morbidity and premature death from cancer. As cancer treatment costs increase, prevention and early detection efforts become more cost-effective, and potentially cost-saving.
Cancer results in economic burden for patients, healthcare systems, and countries due to healthcare spending, and productivity losses from morbidity and premature mortality. Economic analyses can inform resource allocation decisions and investments in cancer control programs, including prevention, early detection, treatment, survivorship, and end-of-life care.
The global economic burden of cancer is unknown, although data are available in some countries. In the US in 2017, estimated cancer healthcare spending was US$161.2 billion; productivity loss from morbidity, US$30.3 billion; and premature mortality, US$150.7 billion. The economic burden of cancer in the US is approximately 1.8% of gross domestic product (GDP). In the European Union, healthcare spending was €57.3 billion, and productivity losses due to morbidity and premature death were €10.6 billion and €47.9 billion, respectively. With informal care costs of €26.1 billion, total burden rose to €141.8 billion, 1.07% of GDP. (Figure 1; for details on inflation adjustment, see Page Sources at bottom of page) Productivity losses due to premature deaths vary in transitioning countries. (Figure 2)
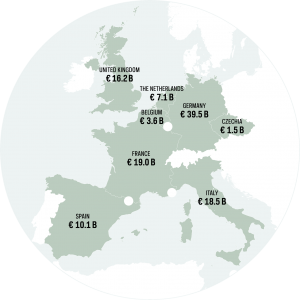
Figure 1. Total costs of cancer in billions of Euro including cancer care and productivity losses in 2009, select European countries. For details on inflation adjustment, see Sources and Methods.
Belgium, 3.6 billion Euros. Czechia, 1.5 billion Euros. France, 19 billion Euros. Germany, 39.5 billion Euros. Italy, 18.5 billion Euros. Netherlands, 7.1 billion Euros. Spain, 10.1 billion Euros. UK, 16.2 billion Euros.
ACCESS CREATES PROGRESS
Vaccination against human papillomavirus infection in 73 countries supported by Gavi, the Vaccine Alliance, could avert nearly US$5.6 billion in treatment costs and productivity losses between 2001–2020.
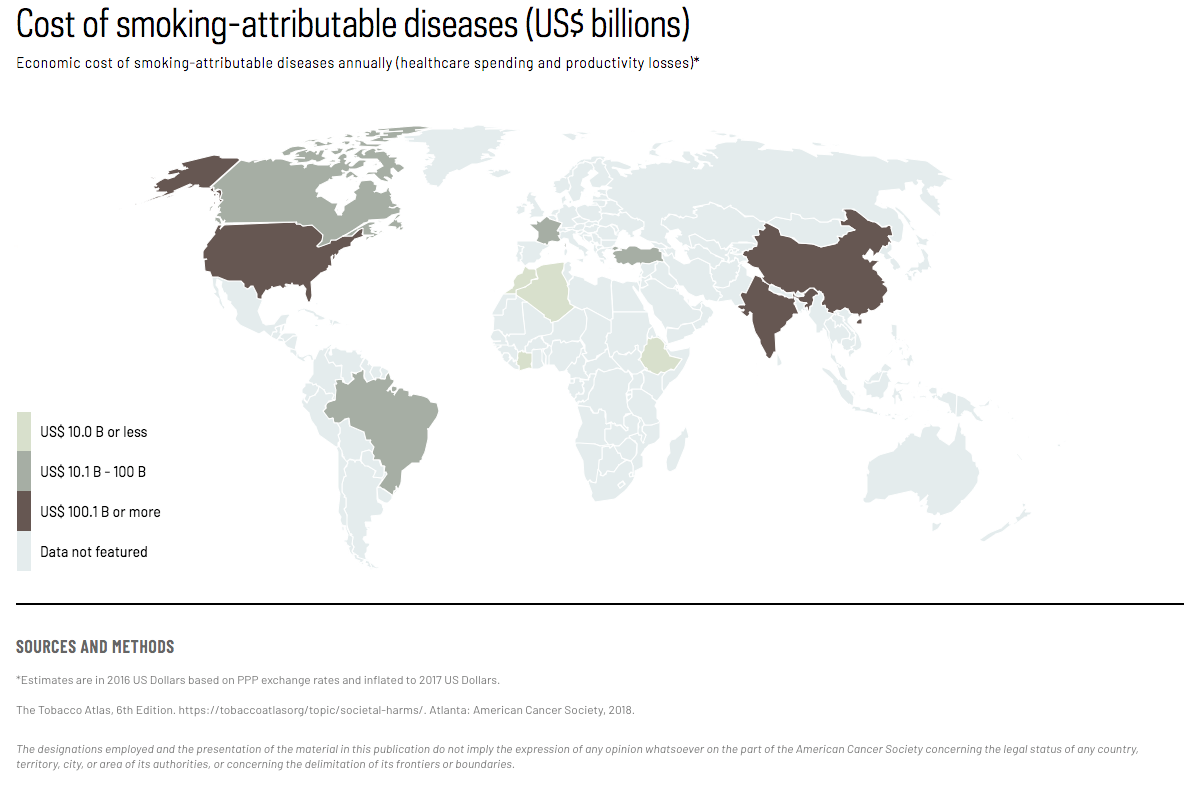
Cancer treatment costs are increasing worldwide, making prevention and screening efforts more cost-effective and sometimes cost-saving. For example, when more expensive chemotherapies were considered in comparisons of colorectal cancer screening to no screening, treatment savings from preventing advanced cancer and death more than doubled in the US. Vaccination against human papillomavirus infection, which is responsible for most cervical cancers, in 73 countries supported by Gavi, the Vaccine Alliance, could avert nearly $5.6 billion in treatment costs and productivity losses between 2001–2020. Smoking is a strong risk factor for lung and other cancers. The cost of smoking globally is nearly $2.05 trillion annually, almost 2% of the world’s economic output. (Map 1; for details on inflation adjustment, see Page Sources at bottom of page) Most of this cost is productivity losses from premature death.
Requests will always exceed resources. Doing good is imperative. Doing everything is impossible.
Text:
Estimates for the US are in 2017 US Dollars.
Estimates for the EU are for 27 countries in 2009 adjust to 2017 Euros.
Estimates for HPV vaccination savings from treatment costs and productivity losses are in 2017 US Dollars.
Estimates for the cost of smoking globally are in 2017 US Dollars.
Bradley CJ, Yabroff KR, Dahman B, Feuer EJ, Mariotto A, Brown ML. Productivity costs of cancer mortality in the United States: 2000–2020. J Natl Cancer Inst. 2008;100(24):1763–1770.
CPI inflation calculator. https://www.bls.gov/data/inflation_calculator.htm Accessed Oct 11, 2018.
Guy GP, Jr., Ekwueme DU, Yabroff KR, et al. Economic burden of cancer survivorship among adults in the United States. J Clin Oncol. 2013;31(30):3749–3757.
HICP Index. https://ec.europa.eu/eurostat/web/hicp/methodology/reference-year-2015 Accessed Oct 11, 2018.
Lansdorp-Vogelaar I, van Ballegooijen M, Zauber AG, Habbema JD, Kuipers EJ. Effect of rising chemotherapy costs on the cost savings of colorectal cancer screening. J Natl Cancer Inst. 2009;101(20):1412–1422.
Luengo-Fernandez R, Leal J, Gray A, Sullivan R. Economic burden of cancer across the European Union: a population-based cost analysis. Lancet Oncol. 2013;14(12):1165–1174.
Mariotto AB, Yabroff KR, Shao Y, Feuer EJ, Brown ML. Projections of the cost of cancer care in the United States: 2010–2020. J Natl Cancer Inst. 2011;103(2):117–128.
Pearce A, Sharp L, Hanly P, et al. Productivity losses due to premature mortality from cancer in Brazil, Russia, India, China, and South Africa (BRICS): A population-based comparison. Cancer Epidemiol. 2018;53:27–34.
The Tobacco Atlas, 6th Edition. https://tobaccoatlasorg/topic/societal-harms/. Atlanta: American Cancer Society, 2018.
Figure 1:
Estimates in 2009 prices with adjustments based on purchasing power parity exchange rates and inflated to 2017 Euros.
Luengo-Fernandez R, Leal J, Gray A, Sullivan R. Economic burden of cancer across the European Union: a population-based cost analysis. Lancet Oncol. 2013;14(12):1165–1174.
Figure 2:
Estimates are in 2012 US Dollars with adjustments based on purchasing power parity exchange rates and inflated to 2017 US Dollars.
Pearce A, Sharp L, Hanly P, et al. Productivity losses due to premature mortality from cancer in Brazil, Russia, India, China, and South Africa (BRICS): A population-based comparison. Cancer Epidemiol. 2018;53:27–34.
Figure 3:
Estimates are in 2016 US Dollars based on PPP exchange rates and inflated to 2017 US Dollars.
The Tobacco Atlas, 6th Edition. https://tobaccoatlasorg/topic/societal-harms/. Atlanta: American Cancer Society, 2018.
Explore Related Topics
This figure cannot be displayed at mobile resolutions.
To view this figure, please visit the desktop version of this website or download the PDF file of the book chapter.