Northern America
Lung cancer remains the leading cause of cancer death in Northern America, despite decades of declines in smoking prevalence.
Cancer is the leading cause of death in Canada and the second-leading cause, after heart disease, in the USA. About 1.9 million new cancer cases and 693,000 cancer deaths were estimated to have occurred in Northern America in 2018. The most commonly diagnosed cancers are prostate in males and breast in females, while lung cancer remains the most common cause of cancer death in both sexes. (Figure 1)
Figure 1. Estimated number of new cancer cases vs. deaths and distribution (%) by type (excludes non-melanoma skin cancer) in Northern America, both sexes, 2018. There were an estimated 1.9 million cancer cases. The leading cancer cases are breast (14%), lung (13%), prostate (12%), colorectum (10%), bladder (5%), non-Hodgkin lymphoma (4%), melanoma of the skin (4%), and other cancers (38%). There were an estimated 693,000 cancer deaths. The leading cancer deaths are lung (25%), colorectum (9%), pancreas (7%), breast (7%), liver (5%), prostate (5%), leukemia (4%), and other cancers (38%).
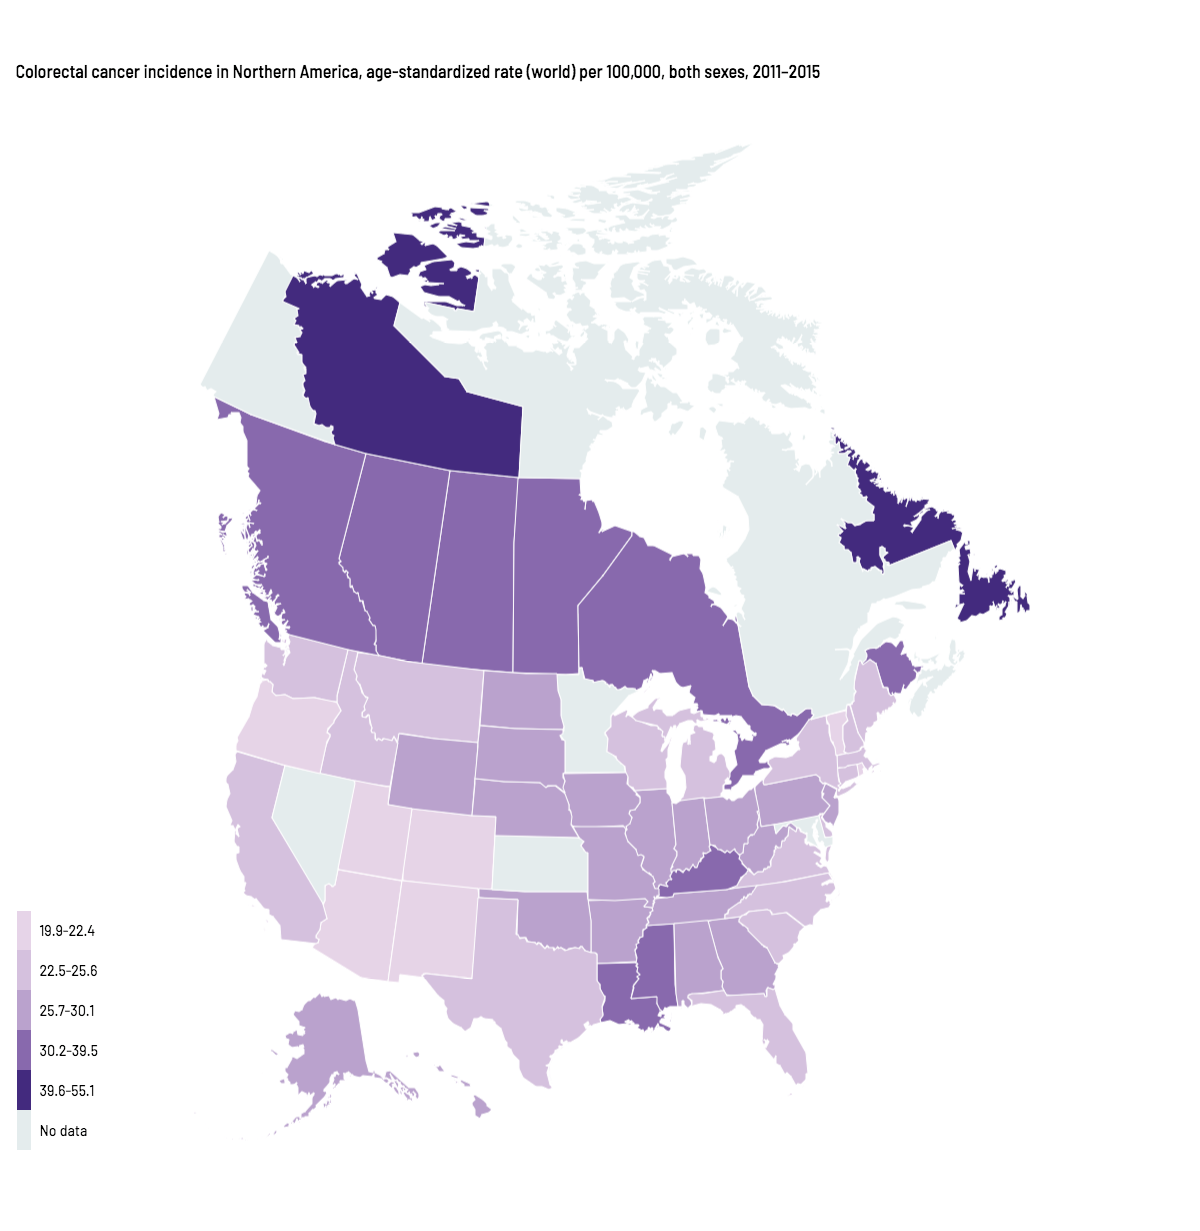
Patterns in cancer occurrence are similar in the USA and Canada, reflecting the shared prevalence of behaviors associated with disease risk. Incidence is relatively low for infection-related cancers, and high for cancers associated with lifestyle “westernization”. For example, Northern America has among the highest incidence of colorectal cancer worldwide. However, because this cancer is amenable to primary prevention and treatment, there is substantial socioeconomic and geographic variation in incidence and mortality within the region. (Map1, Figure 2) For instance, incidence rates of colorectal cancer are two-fold higher among residents of the North and Atlantic regions of Canada than among residents in the Western US, largely because of differences in risk factor exposures and access to screening.
Figure 2. Trends in colorectal cancer mortality in Massachusetts and Mississippi, 1970–2016. Age-standardized rate (world) per 100,000. Colorectal cancer mortality rates in Massachusetts decreased from 19.8 deaths per 100,000 in 1970 to 6.4 in 2016. Colorectal cancer mortality rates in Mississippi remained around 12 deaths per 100,000 from 1970 to 2016.
Cancer trends in the two countries are likewise comparable, with mortality rates declining continuously for more than two decades because of improvements in prevention, early detection, and treatment. Progress against tobacco-related diseases as a result of reductions in smoking is reflected in declines for lung cancer, which are slower and more prolonged among women than men because of later uptake of smoking and slower cessation. (Figure 3)
Figure 3. Lung cancer incidence trends by sex in the United States and Canada, 1975–2015. Age-standardized rate (world) per 100,000.
Among males, lung cancer incidence rates peaked around 65 cases per 100,000 in the mid-1980s before declining to about 35 in 2015.
Among females, lung cancer incidence rates peaked around 30-35 cases per 100,000 in the late 1990s before plateauing in Canada and declining slightly in the US.
Colorectal cancer incidence rates have decreased by almost 40% since 2000 in adults 50 and older, largely because of increased screening, which allows for removal of precancerous polyps. (Figure 4) In contrast, rates are rising in young adults for cancers associated with excess body weight, such as colorectal and endometrial cancers, foreshadowing the health effects of the obesity epidemic. (Figure 5)
The crisis is obesity. It’s the fastest-growing cause of disease and death in America. And it’s completely preventable.
Figure 4. Colorectal cancer incidence trends among adults ≥50 years of age in the United States and Canada, 1975–2015. Age-standardized rate (world) per 100,000. In the United States, colorectal cancer incidence rates among adults 50 and older peaked at 184 cases per 100,000 in 1985 before declining to 98 in 2015.
In Canada, colorectal cancer incidence rates among adults 50 and older peaked at 169 cases per 100,000 in 1985 before declining to 140 in 2015.
Figure 5. Uterine corpus and colorectal (both sexes combined) cancer incidence trends, age <50 years, in the United States and Canada, 1975–2015. Age-standardized rate (world) per 100,000.
In the US and Canada, colorectal cancer incidence rates among those less than 50 years of age declined to a low of less than 4 cases per 100,000 in the 1990s before increasing to 5-6 in 2015.
In the US and Canada, uterine corpus cancer incidence rates among females less than 50 years of age declined to about 3 cases per 100,000 in the United States and 2.5 in Canada in the 1990s before increasing to around 4 in 2015.
Endometrial cancers in the US:
Islami F, Sauer AG, Miller KD, et al. Proportion and number of cancer cases and deaths attributable to potentially modifiable factors in the United States in 2014. CA Cancer J Clin. 2018;68: 31–54.
Text:
Bray F, Ferlay J, Soerjomataram I, Siegel RL, Torre LA, Jemal A. Global cancer statistics 2018: GLOBOCAN estimates of incidence and mortality worldwide for 36 cancers in 185 countries. CA Cancer J Clin. 2018;68.
Copeland G, Green D, Firth R, et al. Cancer in North America: 2011–2015. Volume One: Combined Cancer Incidence for the United States, Canada and North America. Springfield, IL: North American Association of Central Cancer Registries, Inc., 2018.
de Martel C, Ferlay J, Franceschi S, et al. Global burden of cancers attributable to infections in 2008: a review and synthetic analysis. Lancet Oncol. 2012;13: 607–615.
Holford TR, Levy DT, McKay LA, et al. Patterns of birth cohort-specific smoking histories, 1965–2009. Am J Prev Med. 2014;46: e31-37.
Islami F, Sauer AG, Miller KD, et al. Proportion and number of cancer cases and deaths attributable to potentially modifiable factors in the United States in 2014. CA Cancer J Clin. 2018;68: 31–54.
Perdue DG, Haverkamp D, Perkins C, Daley CM, Provost E. Geographic variation in colorectal cancer incidence and mortality, age of onset, and stage at diagnosis among American Indian and Alaska Native people, 1990–2009. Am J Public Health. 2014;104 Suppl 3: S404-414.
The Global Burden of Disease Obesity Collaborators. Health effects of overweight and obesity in 195 countries over 25 years. N Engl J Med. 2017; 377: 13–27.
Tung J, Politis CE, Chadder J, et al. The north–south and east–west gradient in colorectal cancer risk: a look at the distribution of modifiable risk factors and incidence across Canada. Curr Oncol. 2018; 25: 231–5.
Map and Figure 1:
North American Association of Central Cancer Registries public use dataset US mortality data, National Center for Health Statistics, Centers for Disease Control and Prevention, 2018.
Figure 2:
Ferlay J, Ervik M, Lam F, et al. Global Cancer Observatory: Cancer Today. Lyon, France: IARC. Available from: https://gco.iarc.fr/today.
Figures 3, 4, and 5:
Surveillance, Epidemiology, and End Results (SEER) Program (www.seer.cancer.gov) SEER*Stat Database: Incidence – SEER 9 Regs Research Data with Delay-Adjustment, Malignant Only, Nov 2018 Sub (1975–2016) <Katrina/Rita Population Adjustment> – Linked To County Attributes – Total U.S., 1969–2017 Counties, National Cancer Institute, DCCPS, Surveillance Research Program, released April 2019, based on the November 2018 submission.
Ferlay J, Colombet M and Bray F. Cancer Incidence in Five Continents, CI5plus: IARC CancerBase No. 9 [Internet]. Lyon, France: International Agency for Research on Cancer; 2018. Available from: http://ci5.iarc.fr.