Chapter 21 The Burden

Cancer in Indigenous Populations

Cervical cancer screening rates among Aboriginal and Torres Strait Islander women in Australia are only half those of non-Indigenous women.

Cancer remains a stark example of the deep inequities in health care faced by Indigenous communities.

The United Nations reports that over 476 million Indigenous people reside in over 90 countries across the globe, representing 6.2% of the world’s total population. Despite being a numerical minority worldwide, Indigenous people contribute significantly to global cultural diversity, with an estimated 5,000 distinct cultures and over 7,000 languages (Figure 21.1).

Figure 21.1

The World’s Indigenous Peoples

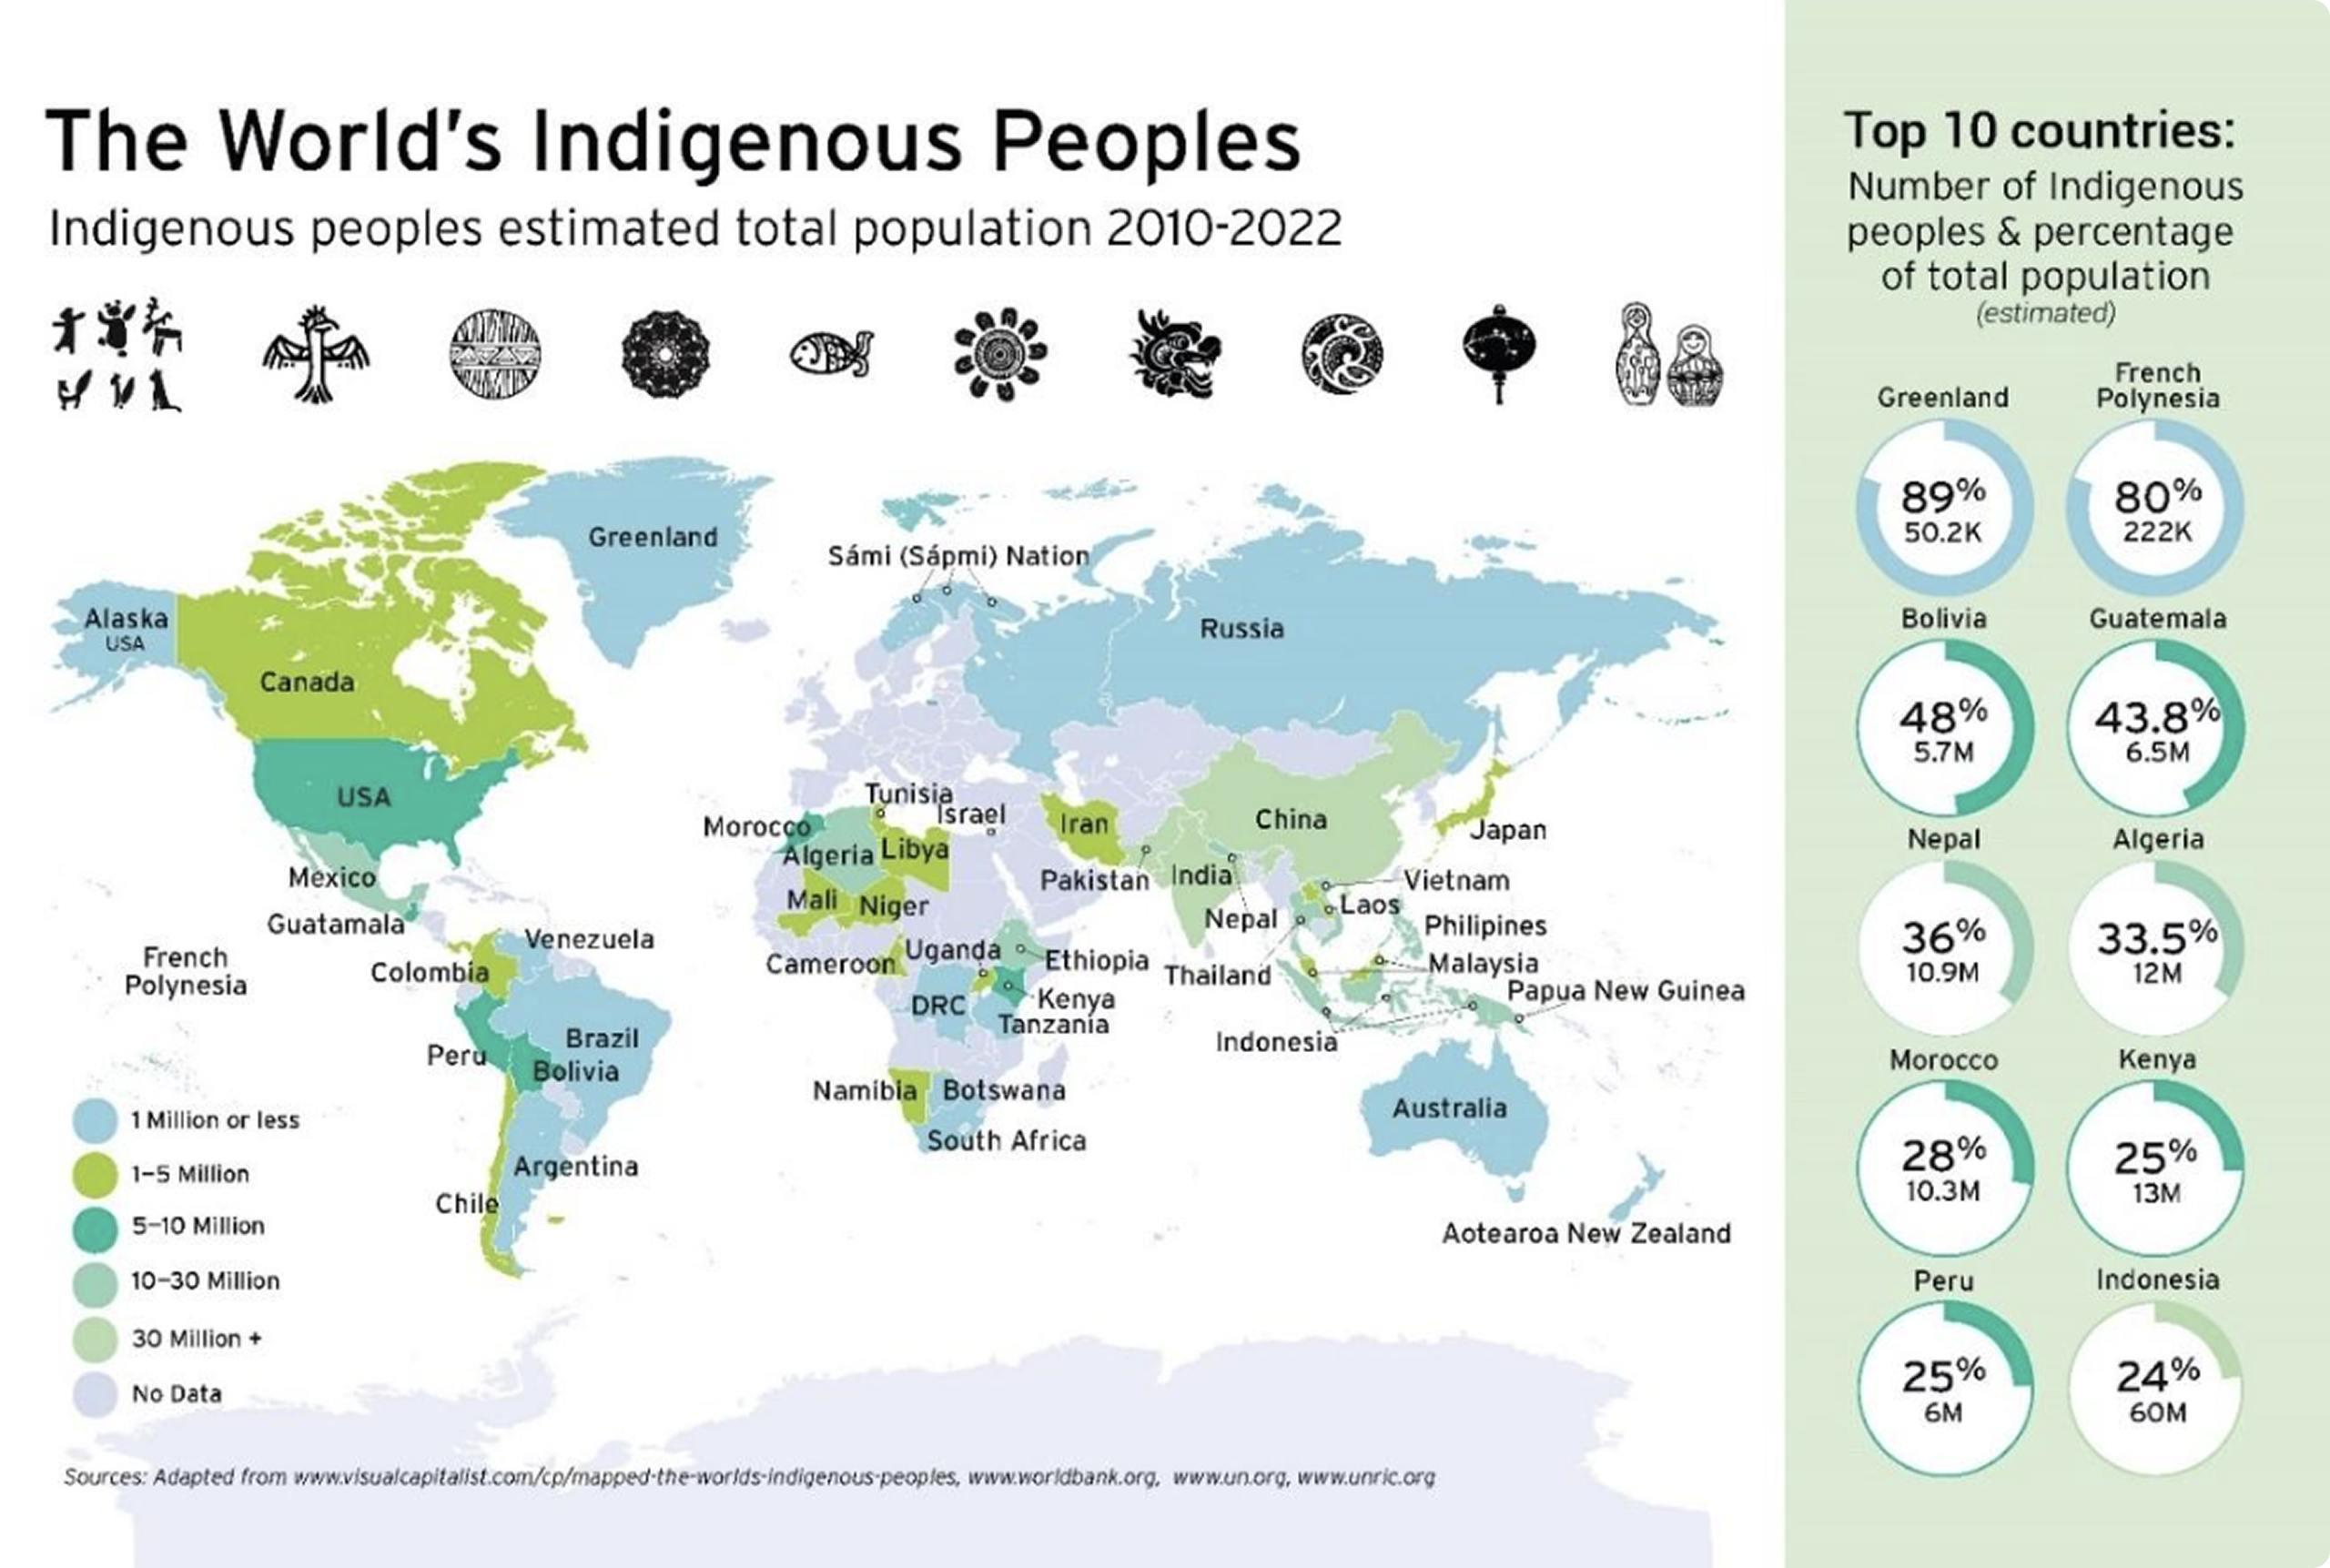
Comprehensive cancer-related data for Indigenous populations is limited in many regions. Most reported information comes from a few high-income countries (e.g., Australia, Canada, New Zealand, the US, Norway, Sweden, and Finland) and some parts in Africa and South America.

“As long as cancer continues to have such a devastating impact on our people and communities, we will advocate for the changes needed to achieve health equity in cancer care.”

—Queensland Aboriginal and Islander Health Council, 2024

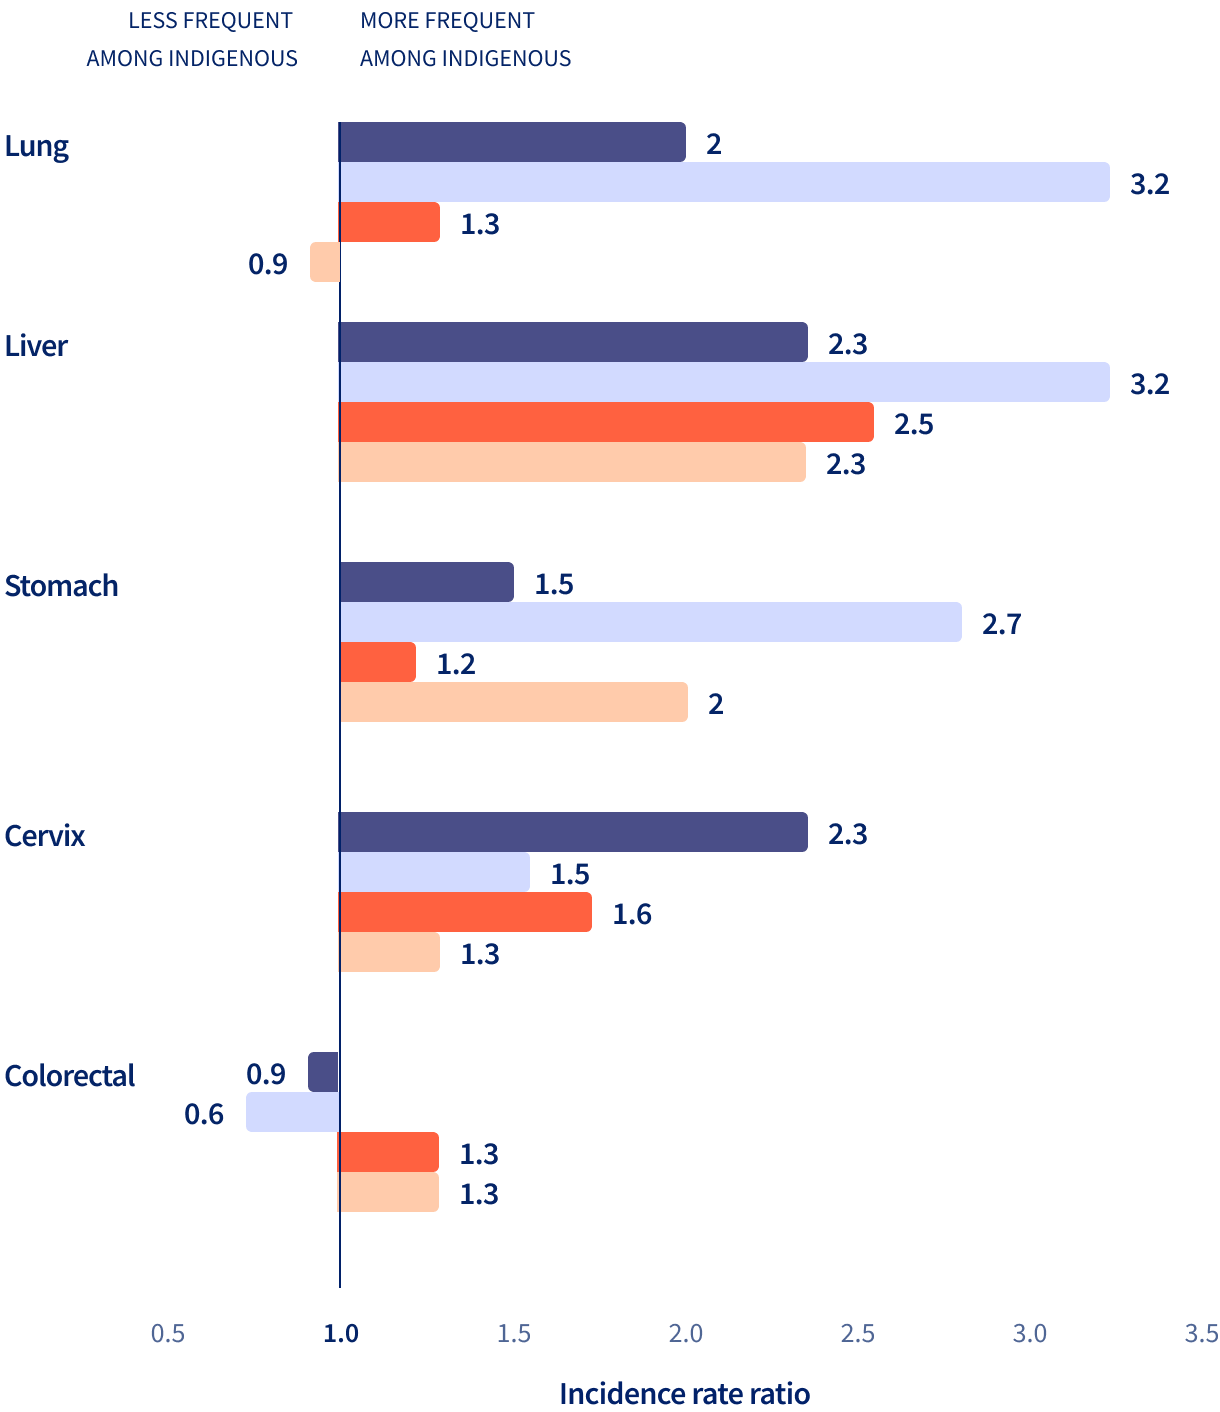
Indigenous people often experience greater disadvantages and poorer health outcomes compared to non-Indigenous people due to historic and ongoing systematic discrimination. Globally, Indigenous people experience higher incidence and lower survival for cancers such as lung, liver, and cervix. The incidence of these highly preventable and common cancers is markedly greater in Indigenous people compared with non-Indigenous people in Australia and New Zealand, with rates up to three times higher in Indigenous populations (Figure 21.2).

Preventable cancers are markedly higher in Indigenous people.

Figure 21.2

​Cancer incidence rate ratios comparing Indigenous and non-Indigenous populations for common cancers in selected countries​

Australia
New Zealand
Canada
United States

A range of sociocultural and political factors, with varying relative importance across regions, contribute to the high cancer burden among Indigenous populations, including a high prevalence of smoking, consumption of alcohol, unhealthy diets, physical inactivity, and excess body weight (Figure 21.3).

Disparities in the prevalence of cancer risk factors are key drivers of the unequal burden of preventable cancers between Indigenous and non-Indigenous populations.

Figure 21.3

Smoking prevalence (%) among Indigenous adults in comparison to non-Indigenous adults in selected countries

Footnote

Indigenous populations for each country: Australia - Aboriginal and Torres Strait Islanders (2018-2019), USA – American Indian and Alaskan Native (2022), Canada - Aboriginal (First Nations, Inuit, Metis) (2022), New Zealand - Māori (2022-2023). Smokers are defined as persons who smoke daily, at least once a week, and less than weekly, except for Canadian smokers defined as smoking in the past 30 days.

Indigenous peoples have not fully benefitted from cancer screening programs, with screening participation rates generally lower compared to non-Indigenous people (Figure 21.4). For instance, cervical cancer screening rates were 28% among Aboriginal and Torres Strait Islander women, compared to 53% among non-Indigenous women in Australia. Similarly, 62% of Māori women underwent cervical cancer screening, compared to 77% of non-Indigenous women in New Zealand.

Figure 21.4

Cancer screening prevalence (%) among Indigenous and non-Indigenous populations in selected countries

Indigenous
Non-Indigenous

AUSTRALIA

UNITED STATES

NEW ZEALAND

CANADA

Comprehensive and persistent initiatives driven by Indigenous leadership and engagement are crucial for enhancing cancer outcomes among Indigenous populations. Progress in cancer control planning tailored by and for Indigenous communities is underway in some regions.

Sources

Figures

  • Figure 21.1: Visual Capitalist. Mapped: The World's Indigenous Peoples. Visual Capitalist. https://www.visualcapitalist.com/cp/mapped-the-worlds-indigenous-peoples. Accessed October 2, 2024.
  • Figure 21.1: World Bank. https://www.worldbank.org/. Accessed October 2, 2024.
  • Figure 21.1: United Nations. https://www.un.org/. Accessed October 2, 2024.
  • Figure 21.1: United Nations Regional Information Centre (UNRIC). United Nations. https://www.unric.org/. Accessed October 2, 2024.
  • Figure 21.2: Australian Institute of Health and Welfare. Cancer in Australia 2021. Cancer series no. 133. Cat. no. CAN 144. Canberra: AIHW. https://www.aihw.gov.au/reports/cancer/cancer-in-australia-2021/summary. Accessed October 2, 2024.
  • Figure 21.2: Australian Institute of Health and Welfare. Cancer in Indigenous Australians. https://www.aihw.gov.au/reports/cancer/cancer-in-indigenous-australians/contents/cancer-type. Accessed October 2, 2024.
  • Figure 21.2: Te Whatu Ora – Health New Zealand. Cancer Web Tool. https://tewhatuora.shinyapps.io/cancer-web-tool/. Accessed October 2, 2024.
  • Figure 21.2: Malagón T, Morais S, Tope P, El-Zein M, Franco EL. Site-Specific Cancer Incidence by Race and Immigration Status in Canada 2006-2015: A Population-Based Data Linkage Study. Cancer Epidemiol Biomarkers Prev. Jul 5 2023;32(7):906-918. doi:10.1158/1055-9965.Epi-22-1191
  • Figure 21.2: SEER*Explorer: An interactive website for SEER cancer statistics [Internet]. Surveillance Research Program, National Cancer Institute; 2023 Apr 19. [updated: 2023 Nov 16; cited 2024 Feb 23]. https://seer.cancer.gov/statistics-network/explorer/. Data source(s): U.S. Mortality Data (1969-2020), National Center for Health Statistics, CDC. Accessed on October 2, 2024.
  • Figure 21.2: Sanchez-Ramirez DC, Colquhoun A, Parker S, Randall J, Svenson LW, Voaklander D. Cancer incidence and mortality among the Métis population of Alberta, Canada. Int J Circumpolar Health. 2016;75:30059. doi:10.3402/ijch.v75.30059
  • Figure 21.2: Louchini R, Beaupré M. Cancer incidence and mortality among Aboriginal people living on reserves and northern villages in Quebec, 1988–2004. International Journal of Circumpolar Health. 2008/12/01 2008;67(5):445-451. doi:10.3402/ijch.v67i5.18355
  • Figure 21.3: Centers for Disease Control and Prevention. United States Cancer Statistics (USCS): Tobacco Use. https://gis.cdc.gov/Cancer/USCS/#/TobaccoUse/. Accessed October 2, 2024.
  • Figure 21.3: Australian Government. Tobacco Use (Measure 2.15). Indigenous Health Performance Framework. https://www.indigenoushpf.gov.au/measures/2-15-tobacco-use. Accessed October 2, 2024.
  • Figure 21.3: Ministry of Health New Zealand. New Zealand Health Survey 2022/23 Annual Data Explorer. https://minhealthnz.shinyapps.io/nz-health-survey-2022-23-annual-data-explorer/_w_20db6f82/#!/explore-topics. Accessed October 2, 2024.
  • Figure 21.3: Canadian Tobacco and Nicotine Survey (CTNS): 2022 detailed tables. https://www.canada.ca/en/health-canada/services/canadian-tobacco-nicotine-survey/2022-summary/2022-detailed-tables.html#tblC. Accessed October 2, 2024.
  • Figure 21.3: World Health Organization. WHO global report on trends in prevalence of tobacco use 2000–2030. https://www.who.int/publications/i/item/9789240088283. Accessed October 2, 2024.
  • Figure 21.4: Dasgupta P, Aitken JF, Condon J, et al. Spatial and temporal variations in cervical cancer screening participation among indigenous and non-indigenous women, Queensland, Australia, 2008–2017. Cancer Epidemiology. 2020/12/01/ 2020;69:101849. doi:https://doi.org/10.1016/j.canep.2020.101849
  • Figure 21.4: Withrow DR, Amartey A, Marrett LD. Cancer risk factors and screening in the off-reserve First Nations, Métis and non-Aboriginal populations of Ontario. Chronic Dis Inj Can. Jul 2014;34(2-3):103-12.
  • Figure 21.4: Australian Institute of Health and Welfare (2024) BreastScreen Australia monitoring report 2024, catalogue number CAN 162, AIHW, Australian Government.
  • Figure 21.4: Australian Institute of Health and Welfare (2024) National bowel cancer screening program monitoring report 2024, catalogue number CAN 160, AIHW, Australian Government.
  • Figure 21.4: U.S. Cancer Statistics Working Group. U.S. Cancer Statistics Data Visualizations Tool. U.S. Department of Health and Human Services, Centers for Disease Control and Prevention and National Cancer Institute; https://www.cdc.gov/cancer/dataviz, released in June 2024.
  • Figure 21.4: BreastScreen Aotearoa Coverage Report, New Zealand. https://tewhatuora.shinyapps.io/nsu-bsa-coverage/. Accessed October 16, 2024.
  • Figure 21.4: National Cervical Screening Programme Coverage Report, New Zealand. https://tewhatuora.shinyapps.io/nsu-ncsp-coverage/. Accessed October 16, 2024.
  • Figure 21.4: National Bowel Screening Programme, New Zealand. https://tewhatuora.shinyapps.io/nphs-nbsp/. Accessed October 16, 2024.