Cancer in Children
The childhood cancer burden is strongly related to level of development, with high incidence in high-income countries but higher mortality in low-income countries.
Cancers occurring in childhood and adolescence differ markedly from cancers in adults in their incidence and tumor characteristics. Worldwide, the average annual incidence in children aged less than 15 years is 140 new cases per million children, although there are threefold variations between world regions and ethnic groups. (Figure 2) The low rates recorded by population-based cancer registries in some low-income countries are thought to result from under-diagnosis. (Figure 1)
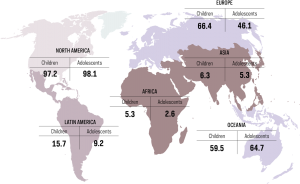
In Northern America, there is 97.2% registration coverage for cancer in children and 98.1% coverage for cancer in adolescents. In Latin America, there is 15.7% registration coverage for cancer in children and 9.2% coverage for cancer in adolescents. In Africa, there is 5.3% registration coverage for cancer in children and 2.6% coverage for cancer in adolescents. In Europe, there is 66.4% registration coverage for cancer in children and 46.1% coverage for cancer in adolescents. In Asia, there is 6.3% registration coverage for cancer in children and 5.3% coverage for cancer in adolescents. In Oceania, there is 59.5% registration coverage for cancer in children and 64.7% coverage for cancer in adolescents.
The most common cancers in children are leukemia and lymphoma, while the major cancers among adults, such as carcinoma of the lung, breast or colon, are rare in children. The incidence of carcinomas increases progressively with age, and together with lymphomas or germ cell tumors they become the most common cancers in adolescents aged 15–19 years, with the overall incidence rate rising to 185 per million. In contrast, the incidence of embryonal tumors, such as neuroblastoma, retinoblastoma, and nephroblastoma is very low in adolescents. (Figure 3)
Figure 2. Ages 0-14 years: age-standardized cancer incidence rates (world) per million population, 2001-2010. Cancer incidence rates per million among children age 0 to 14 years by world region are the following: In Sub-Saharan Africa, leukemia: 12.5; lymphomas, 9.8; central nervous system tumors, 6.3; sympathetic nervous system cancers, 2.7; soft tissue sarcomas, 7.6; and other neoplasms, 17.4. In North Africa, leukemia: 28.2; lymphomas, 25.6; central nervous system tumors, 16.5; sympathetic nervous system cancers, 8.8; soft tissue sarcomas, 7.2; and other neoplasms, 24.6. In South Asia (India only), leukemia: 34.1; lymphomas, 12; central nervous system tumors, 12.4; sympathetic nervous system cancers, 3.2; soft tissue sarcomas, 4.5; and other neoplasms, 21.3. In East Asia, leukemia: 47.4; lymphomas, 12.7; central nervous system tumors, 20.6; sympathetic nervous system cancers, 12; soft tissue sarcomas, 7.2; and other neoplasms, 35.9. In Southeast Asia, leukemia: 52.7; lymphomas, 9.5; central nervous system tumors, 12.9; sympathetic nervous system cancers, 4.4; soft tissue sarcomas, 5.2; and other neoplasms, 35.1. In West Asia, leukemia: 45.2; lymphomas, 22.6; central nervous system tumors, 24.5; sympathetic nervous system cancers, 10.1; soft tissue sarcomas, 8.2; and other neoplasms, 30.3. In Latin America, leukemia: 48.7; lymphomas, 16.7; central nervous system tumors, 23; sympathetic nervous system cancers, 7.5; soft tissue sarcomas, 7.5; and other neoplasms, 29.3. In North America, leukemia: 52.1; lymphomas, 15.3; central nervous system tumors, 33; sympathetic nervous system cancers, 12.6; soft tissue sarcomas, 10.3; and other neoplasms, 34.3. In Europe, leukemia: 49.1; lymphomas, 16.3; central nervous system tumors, 36.6; sympathetic nervous system cancers, 12.5; soft tissue sarcomas, 9.5; and other neoplasms, 32.5. In Oceania, leukemia: 56.4; lymphomas, 15.3; central nervous system tumors, 26.2; sympathetic nervous system cancers, 11.4; soft tissue sarcomas, 9; and other neoplasms, 34.6. By US ethnic group, cancer incidence rates per million among children age 0 to 14 years are the following: In US Native Americans, leukemia: 31.5; lymphomas, 7.5; central nervous system tumors, 14.4; sympathetic nervous system cancers, 5.7; soft tissue sarcomas, 4.6; and other neoplasms, 29.4. In US Asians and Pacific Islanders, leukemia: 43.9; lymphomas, 12.1; central nervous system tumors, 19.9; sympathetic nervous system cancers, 7.7; soft tissue sarcomas, 5.8; and other neoplasms, 39.7. In US Blacks, leukemia: 31.3; lymphomas, 13.4; central nervous system tumors, 26.2; sympathetic nervous system cancers, 10.2; soft tissue sarcomas, 10.8; and other neoplasms, 52. In US White Hispanics, leukemia: 65.4; lymphomas, 16.2; central nervous system tumors, 28.6; sympathetic nervous system cancers, 8.6; soft tissue sarcomas, 10.2; and other neoplasms, 53.4. In US White Non-Hispanics, leukemia: 54.5; lymphomas, 15.8; central nervous system tumors, 38.2; sympathetic nervous system cancers, 15; soft tissue sarcomas, 10.9; and other neoplasms, 62.
Figure 3. Ages 15-19 years: age-standardized cancer incidence rates (world) per million population, 2001-2010. Cancer incidence rates per million among adolescents age 15 to 19 years by world region are the following: In Sub-Saharan Africa, leukemia: 19; lymphomas, 27; central nervous system tumors, 6; germ cell and gonadal tumors, 8.6; epithelial tumors and melanoma, 18.6; and other neoplasms, 66.5. In North Africa, leukemia: 26.4; lymphomas, 37; central nervous system tumors, 13.9; germ cell and gonadal tumors, 5.7; epithelial tumors and melanoma, 22.1; and other neoplasms, 34.6. In South Asia (India only), leukemia: 21.8; lymphomas, 13.3; central nervous system tumors, 10.2; germ cell and gonadal tumors, 6.9; epithelial tumors and melanoma, 14.1; and other neoplasms, 24. In East Asia, leukemia: 31.5; lymphomas, 19.4; central nervous system tumors, 15.2; germ cell and gonadal tumors, 19; epithelial tumors and melanoma, 33.4; and other neoplasms, 28.4. In Southeast Asia, leukemia: 26.5; lymphomas, 14.4; central nervous system tumors, 7.4; germ cell and gonadal tumors, 11.5; epithelial tumors and melanoma, 22.1; and other neoplasms, 31. In West Asia, leukemia: 33.7; lymphomas, 52.4; central nervous system tumors, 22; germ cell and gonadal tumors, 14.5; epithelial tumors and melanoma, 31.6; and other neoplasms, 37.2. In Latin America, leukemia: 27.9; lymphomas, 30.4; central nervous system tumors, 14.2; germ cell and gonadal tumors, 17.9; epithelial tumors and melanoma, 30.1; and other neoplasms, 32.3. In North America, leukemia: 29.9; lymphomas, 48.5; central nervous system tumors, 21.1; germ cell and gonadal tumors, 26.1; epithelial tumors and melanoma, 45.2; and other neoplasms, 34.6. In Europe, leukemia: 25.5; lymphomas, 51.8; central nervous system tumors, 27.5; germ cell and gonadal tumors, 25.4; epithelial tumors and melanoma, 41.8; and other neoplasms, 33.2. In Oceania, leukemia: 33; lymphomas, 52.5; central nervous system tumors, 16.8; germ cell and gonadal tumors, 28.6; epithelial tumors and melanoma, 73.2; and other neoplasms, 36. By US ethnic group, cancer incidence rates per million among adolescents age 15 to 19 years are the following: In US Native Americans, leukemia: 24.1; lymphomas, 14.4; central nervous system tumors, 13.6; germ cell and gonadal tumors, 15; epithelial tumors and melanoma, 23.8; and other neoplasms, 20.3. In US Asians and Pacific Islanders, leukemia: 24.1; lymphomas, 28.5; central nervous system tumors, 12.2; germ cell and gonadal tumors, 19.9; epithelial tumors and melanoma, 28; and other neoplasms, 24.6. In US Blacks, leukemia: 22.1; lymphomas, 39.4; central nervous system tumors, 15.4; germ cell and gonadal tumors, 12; epithelial tumors and melanoma, 21.6; and other neoplasms, 34.5. In US White Hispanics, leukemia: 43; lymphomas, 37.3; central nervous system tumors, 15.9; germ cell and gonadal tumors, 36.4; epithelial tumors and melanoma, 31.5; and other neoplasms, 32.1. In US White Non-Hispanics, leukemia: 29.5; lymphomas, 55.1; central nervous system tumors, 24.4; germ cell and gonadal tumors, 27.9; epithelial tumors and melanoma, 57; and other neoplasms, 36.
The incidence of cancer in children and adolescents has been increasing by 0.5 to 1 percent per year in the high-income countries with established cancer registries over the past few decades. Although the increase may in part reflect more frequent diagnosis facilitated by advanced imaging techniques, other factors may have also contributed. Exposures to high doses of ionizing radiation, high birth weight and certain genetic syndromes have been consistently associated with increased risk of cancer in children. The role of other risk factors, such as air pollutants, tobacco or pesticide use, older parental age, or fewer children per family is debated. Potentially protective effects of breastfeeding and folate supplementation are being investigated.
ACCESS CREATES PROGRESS
Burkitt lymphoma is the most common pediatric cancer in many parts of sub-Saharan Africa. While about 90% of children with Burkitt lymphoma in high-income countries can be cured with timely treatment including high-intensity chemotherapy and supportive care infrastructure, about 50% of children with the disease in resource-constrained settings where such treatment is not feasible can be cured with a simplified protocol.
More than 80% of childhood cancer patients in high-income countries survive 5 years after their diagnosis. In many low-income countries, in contrast, the outlook is much less favorable because of suboptimal access to care, late diagnosis, treatment abandonment, inadequacy of therapy, and the financial burden. Survival of childhood cancer patients has been assessed in only a few low-income countries. (Figure 4)
As survival of cancer patients improves over time (Figure 5), many survivors experience chronic health conditions later in life as a consequence of their cancer or the anti-cancer therapy.
Figure 4. Five-year age-standardized net survival (%) observed in the available cohorts of cases diagnosed with lymphoid leukemia. In Western Europe, five-year net survival for children with lymphoid leukemia is 89%, based on a cohort of 4348 children. In Oceania, five-year net survival for children with lymphoid leukemia is 88.9%, based on a cohort of 803 children. In North America, five-year net survival for children with lymphoid leukemia is 88%, based on a cohort of 11014 children. In Northern Europe, five-year net survival for children with lymphoid leukemia is 87.4%, based on a cohort of 2983 children. In Southern Europe, five-year net survival for children with lymphoid leukemia is 85.7%, based on a cohort of 1251 children. In Eastern Europe, five-year net survival for children with lymphoid leukemia is 80%, based on a cohort of 587 children. In East Asia, five-year net survival for children with lymphoid leukemia is 76.9%, based on a cohort of 2242 children. In West Asia, five-year net survival for children with lymphoid leukemia is 73.6%, based on a cohort of 166 children. In Latin America, five-year net survival for children with lymphoid leukemia is 64.5%, based on a cohort of 2234 children. In Southeast Asia, five-year net survival for children with lymphoid leukemia is 60.4%, based on a cohort of 164 children. In Africa, five-year net survival for children with lymphoid leukemia is 43.5%, based on a cohort of 78 children.
Figure 5. Changes in 5-year age-standardized net survival (%) for children aged 0-14 years diagnosed with acute lymphoid leukemia, select countries 1995-2009. Five-year survival for children with acute lymphoid leukemia increased from 40.7% in 1995-1999 to 52.4% in 2005-2009 in Colombia, Cali. Five-year survival for children with acute lymphoid leukemia increased from 51.1% in 1995-1999 to 55% in 2005-2009 in Thai registries. Five-year survival for children with acute lymphoid leukemia increased from 57% in 1995-1999 to 72% in 2005-2009 in Bulgaria. Five-year survival for children with acute lymphoid leukemia increased from 62.8% in 1995-1999 to 73.6% in 2005-2009 in Turkey, Izmir. Five-year survival for children with acute lymphoid leukemia increased from 63.1% in 1995-1999 to 76.4% in 2005-2009 in South Korea. Five-year survival for children with acute lymphoid leukemia increased from 74.3% in 1995-1999 to 88.1% in 2005-2009 in Belarus. Five-year survival for children with acute lymphoid leukemia increased from 79.1% in 1995-1999 to 89.3% in 2005-2009 in UK. Five-year survival for children with acute lymphoid leukemia increased from 82.8% in 1995-1999 to 88.8% in 2005-2009 in Australia. Five-year survival for children with acute lymphoid leukemia increased from 82.8% in 1995-1999 to 88.8% in 2005-2009 in USA. Five-year survival for children with acute lymphoid leukemia increased from 82.4% in 1995-1999 to 89.2% in 2005-2009 in France.
Childhood cancer survivors:
Phillips SM, Padgett LS, Leisenring WM, et al. Survivors of childhood cancer in the United States: prevalence and burden of morbidity. Cancer Epidemiol Biomarkers Prev. 2015;24(4):653–63.
Access creates progress:
Gelband H,Jha P, Sankaranarayanan R, Horton S, eds. 2015. Disease Control Priorities, third edition. Volume 3, Cancer. Chapter 7: Treating childhood cancer in low- and middle-income countries. Washington, DC: World Bank.
Text:
Amitay EL. Breastfeeding and Childhood Leukemia Incidence: A Meta-analysis and Systematic Review. JAMA Pediatr. 2015;169(6):e151025.
Bonaventure A, Harewood R, Stiller CA, et al. Worldwide comparison of survival from childhood leukaemia for 1995-2009, by subtype, age, and sex (CONCORD-2): a population-based study of individual data for 89 828 children from 198 registries in 53 countries. Lancet Haematol. 2017;4(5):e202-e17.
Braganza MZ, Kitahara CM, Berrington de González A, Inskip PD, Johnson KJ, Rajaraman P. Ionizing radiation and the risk of brain and central nervous system tumors: a systematic review. Neuro-Oncology. 2012;14(11):1316–24.
Cantarella CD, Ragusa D, Giammanco M, Tosi S. Folate deficiency as predisposing factor for childhood leukaemia: a review of the literature. Genes Nutr. 2017;12:14.
Caughey RW, Michels KB. Birth weight and childhood leukemia: a meta-analysis and review of the current evidence. Int J Cancer. 2009;124(11):2658–70.
Chiavarini M, Naldini G, Fabiani R. Maternal folate intake and risk of childhood brain and spinal cord tumors: A systematic review and meta-analysis. Neuroepidemiology. 2018;51(1–2):82-95.
Dahlhaus A, Prengel P, Spector L, Pieper D. Birth weight and subsequent risk of childhood primary brain tumors: An updated meta-analysis. Pediatric Blood & Cancer. 2017;64(5).
Howlader NN, Noone AM, Krapcho M, et al. (eds.). SEER Cancer Statistics Review, 1975–2014. Bethesda, MD: National Cancer Institute; 2017.
Phillips SM, Padgett LS, Leisenring WM, et al. Survivors of childhood cancer in the United States: prevalence and burden of morbidity. Cancer Epidemiology Biomarkers Prev. 2015;24(4):653–63.
Ripperger T, Bielack SS, Borkhardt A, et al. Childhood cancer predisposition syndromes-A concise review and recommendations by the Cancer Predisposition Working Group of the Society for Pediatric Oncology and Hematology. Am J Med Genet A. 2017;173(4):1017–37.
Steliarova-Foucher E, Colombet M, Ries LAG, et al. International Incidence of Childhood Cancer, Volume III (electronic version). Lyon: International Agency for Research on Cancer; 2017. Available from: http://iicc.iarc.fr/results/.
Steliarova-Foucher E, Colombet M, Ries LAG, et al. International incidence of childhood cancer, 2001–10: a population-based registry study. Lancet Oncol. 2017;18(6):719–31.
Steliarova-Foucher E, Fidler MM, Colombet M, et al. Changing geographical patterns and trends in cancer incidence in children and adolescents in Europe, 1991-2010: a population-based study. Lancet Oncol. 2018;19(9):1159-69.
Wang KL, Liu CL, Zhuang Y, Qu HY. Breastfeeding and the risk of childhood Hodgkin lymphoma: a systematic review and meta-analysis. Asian Pacific J Cancer Prev. 2013;14(8):4733-7.
Whitehead TP, Metayer C, Wiemels JL, Singer AW, Miller MD. Childhood leukemia and primary prevention. Curr Probl Pediatr Adolesc Health Care. 2016;46(10):317–52.
Figure 1:
Steliarova-Foucher E, Colombet M, Ries LAG, et al. International Incidence of Childhood Cancer, Volume III (electronic version). Lyon: International Agency for Research on Cancer; 2017. Available from: http://iicc.iarc.fr/results/.
Figure 2 and 3:
Steliarova-Foucher E, Colombet M, Ries LAG, et al. International incidence of childhood cancer, 2001–10: a population-based registry study. Lancet Oncol. Jun 2017;18(6):719–731.
Figure 4:
The estimates for regions were calculated as an average of 5-year age-standardized net survival observed in the most recent available period in all areas with at least 50 cases, weighted by the numbers of cases.
Bonaventure A, Harewood R, Stiller CA, et al. Worldwide comparison of survival from childhood leukaemia for 1995–2009, by subtype, age, and sex (CONCORD-2): a population-based study of individual data for 89 828 children from 198 registries in 53 countries. Lancet Haematol. 2017;4(5):e202-e17.
Figure 5:
ibid.